
How to use FBref for match research now the advanced stats are gone
FBref lost its expected goals in January 2026, and most reviews of it still describe the old site. What is left is a free football statistics database covering more than 100 competitions: results, home and away splits, minutes, cards, penalties and head-to-head records. Those numbers answer most of the questions a bet needs, and the ones they no longer answer have moved to other sites.

Pros
- Home and away splits, penalties and cards on one page.
- Links straight from a fixture to the full meeting history.
- Covers small leagues that other free stats sites skip.
- Every table exports to a spreadsheet in two clicks.
Cons
- It cannot show chance quality, only how many shots were taken.
- It has no live data, so nothing arrives during a match.
- It warns that older totals may be incomplete.
The letter that emptied half the site
On 20 January 2026 Sports Reference published a short notice. Their advanced football data provider had ended the agreement and told them to delete the data at once. FBref complied the same week.
Gone: expected goals, expected assisted goals, non-penalty xG, progressive passes and carries, pressures, shot-creating actions, and the percentile scouting reports that made a player page readable in ten seconds. Gone from Stathead too, so paying did not protect anyone.
Most of that list is built on expected goals. The metric scores every shot by how often chances like it get converted. A tap-in from two yards might be worth 0.7 of a goal, a long shot from thirty yards 0.03. Add up a match and the total shows what the chances were worth, not what the finishing produced. A team that wins 2-0 while losing that count is usually a team about to stop winning.
That is why the removal matters.
Goals record the result. Expected goals estimated the performance behind the result, and the performance is the part that repeats.
The provider was Opta, owned by Stats Perform. FBref had signed with them in 2022, replacing StatsBomb. Stats Perform said the site had used the data outside the terms of the agreement. Sports Reference denies that, and chose not to fight a case it might lose rather than concede the point. Only one side has stated what the breach was, and the other side rejects the description.
The timing drew attention. Eight days before the letter, FIFA had named Stats Perform its official distributor of betting data for the 2026 World Cup. The deal covers exclusive rights to supply sportsbooks with player statistics. FBref had been giving that kind of data away for free. Sports Reference did not connect the two events. Most people writing about it since have. A separate theory in the community is that AI systems scraping FBref's open tables gave Opta the argument it needed. That remains speculation, and neither company has confirmed it.
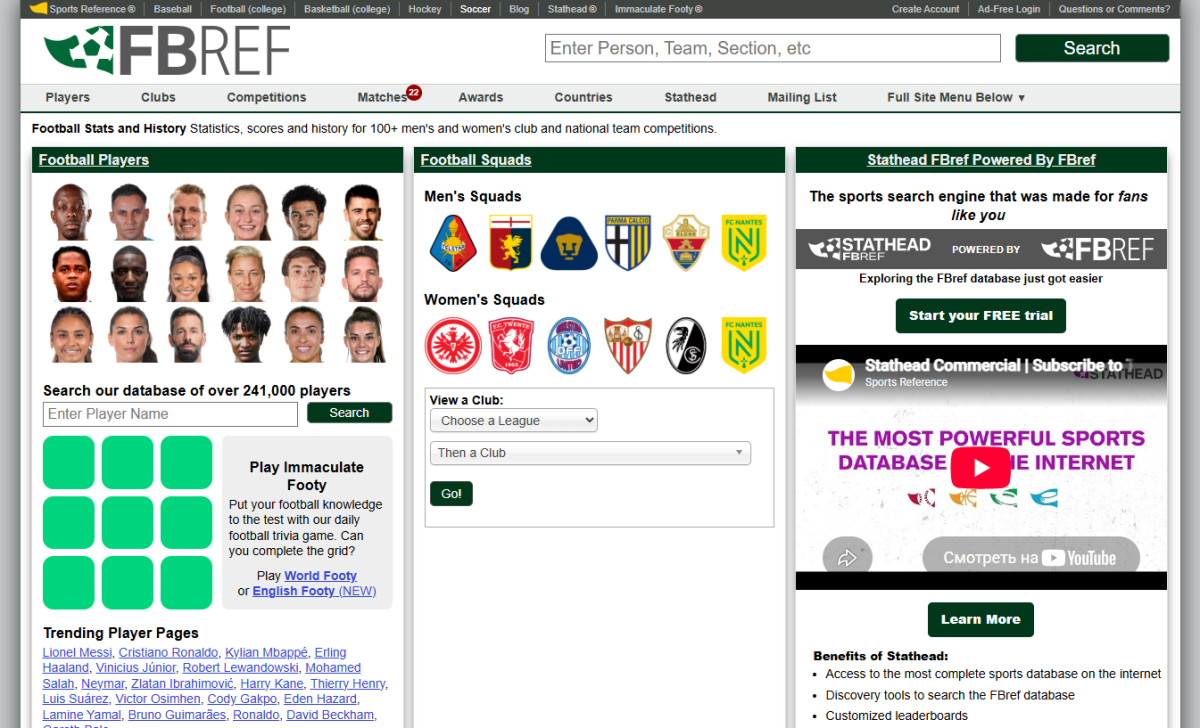
Sports Reference wrote that <cite index=«42-1»>data democratization is a core company value</cite> and that the removal was a bad day for them. They also warned that if advanced data ever returns, it will be on a much smaller scale. As of August 2026 it has not returned, and the notice is still on the homepage.
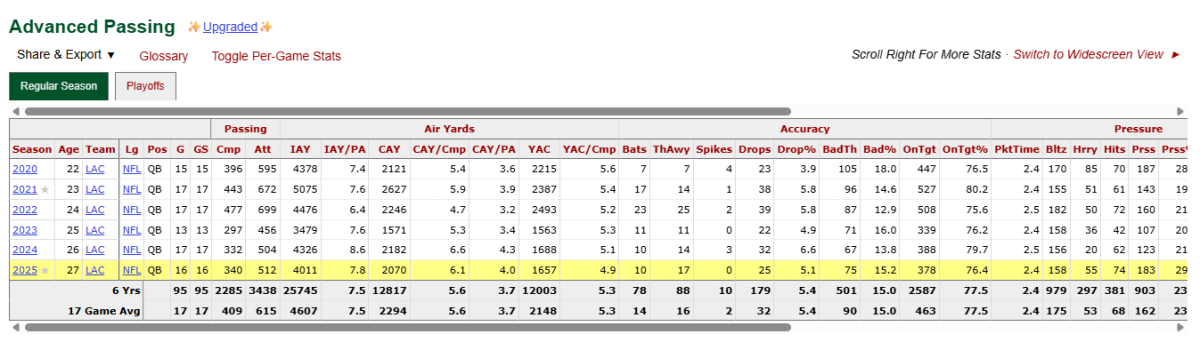
The damage was narrow. Pro Football Reference, the American sister site, still runs full advanced tables with pressure counts and air yards. Those numbers were never licensed from Opta. The deletion took one contract, not a change of policy.
The women's game lost the most
The 2022 deal did something no other free source had done. It brought advanced metrics to around ten women's competitions at once. For four years FBref was the only place to get them without an enterprise contract.
That layer disappeared in January. Basic women's coverage stayed, and it is still wide, but the analytical layer is gone and the replacements barely cover the women's game. One audit of the remaining free sources put women's competitions at roughly a fifth of the expected goals coverage men's competitions get.
Anyone betting women's football is now in a different position from anyone betting the men's game.
The alternatives at the end of this review will not fix it. Most of them never covered these leagues at all.
What survived the deletion
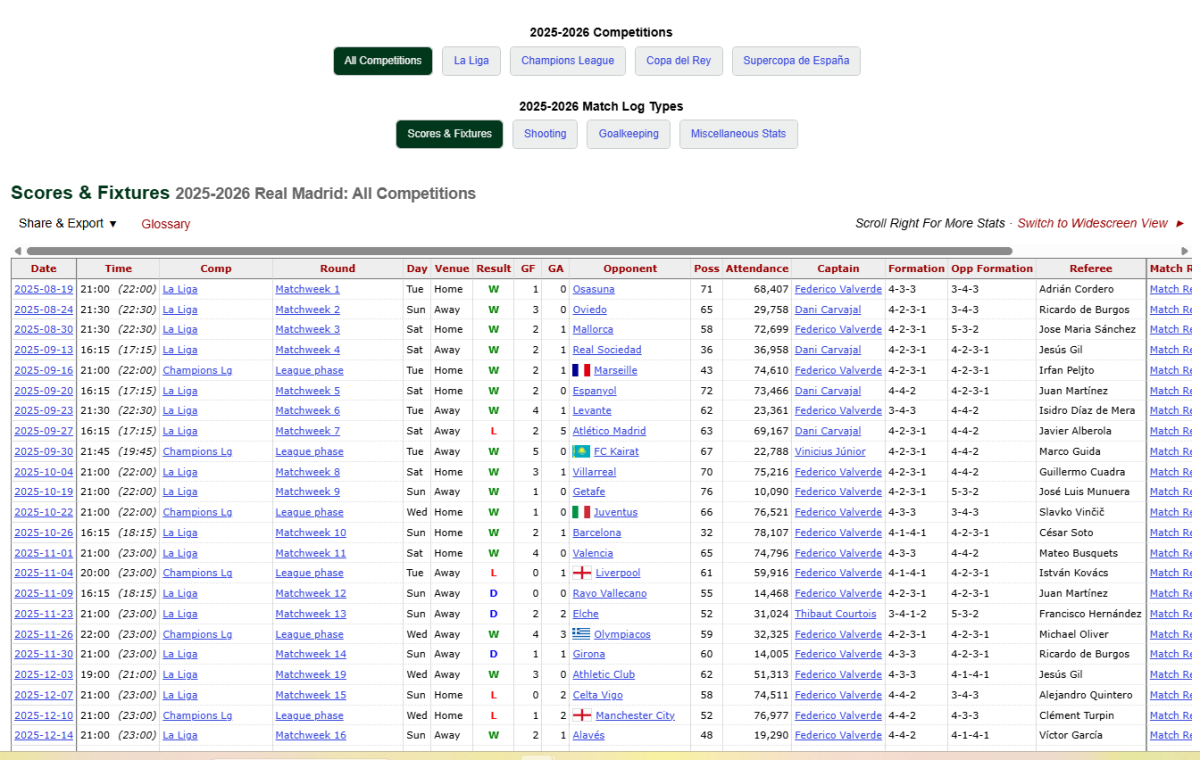
The base is intact, and it is wider than the reporting suggested. A squad page still opens with the season record, the points total, the home and away split, and goals scored and conceded per game. Below it sit four match log types: scores and fixtures, shooting, goalkeeping and miscellaneous stats.
The fixture log carries the date, the competition, the venue, the result, the score, possession, the attendance, the captain, both formations and the referee. The shooting tables carry shots, shots on target, shooting accuracy, goals per shot and goals per shot on target. The goalkeeping tables carry shots faced, saves, save percentage, clean sheets and a full penalty breakdown. The miscellaneous tables carry yellow and red cards, fouls committed, fouls drawn, offsides, crosses, interceptions and penalties won and conceded.
Player pages keep all of that at individual level. They add a playing time table: starts, minutes per start, substitute appearances, minutes per substitute appearance, points per match, and goal difference while the player was on the pitch.
The archive also goes much further back than the seven years of Opta data ever did. That part was never licensed from anyone, so nobody could take it away.
Finding your way around
The site is not built like a scores app, and the first visit confuses people. There are three routes in, and all three are free.
The Competitions index lists every league and cup by country, and each one opens on the current season table. Clicking a club from that table opens its squad page, and the match log types sit as tabs just below the squad tables. That is the path for research on a single team.
The Matches tab is the other route. It shows every result from every covered competition for one day. Links move forward and back through the calendar. Upcoming fixtures carry a head-to-head link for each pairing.
The search box takes player and club names directly, which is faster than either route once you know what you are looking for.
Reading a squad page before a match
Real Madrid finished the 2025-26 La Liga season second on 86 points, from 27 wins, 5 draws and 6 defeats.
The home and away split is the first useful thing on the page. At home they took 49 points from 19 matches, with 16 wins and 2 defeats. Away they took 37, with 11 wins and 4 defeats. Same squad, twelve points of difference, and a defeat rate twice as high on the road.
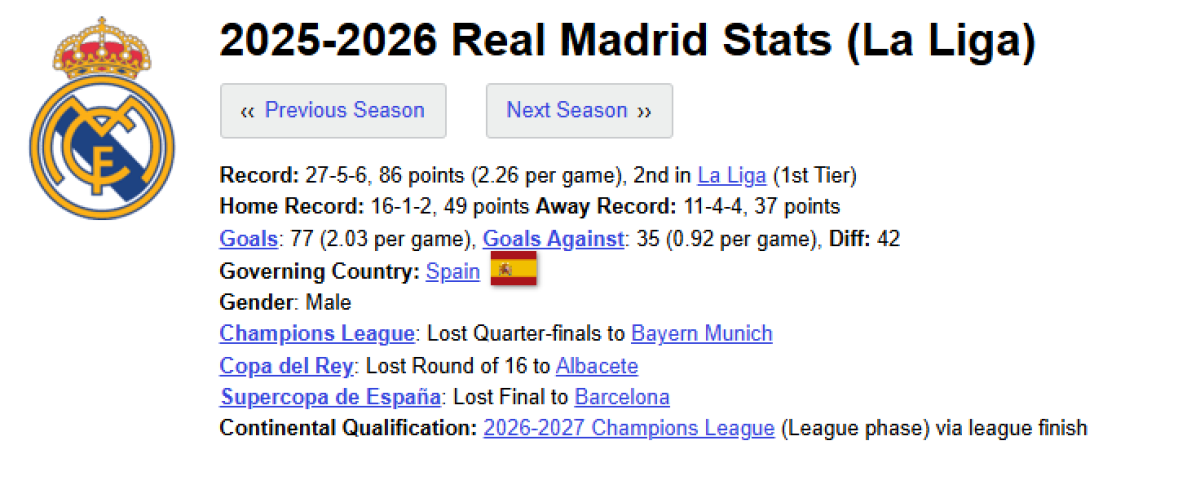
The goal figures come next. 77 scored at 2.03 per game, 35 conceded at 0.92. Combined, that is an average of 2.95 goals in a Real Madrid league match. The match logs do that job better than the summary. They list all 38 scorelines, so the number of matches that went over any line can be counted rather than assumed.
An average is not a hit rate. Turning a price into a percentage shows what the bookmaker thinks the rate is.
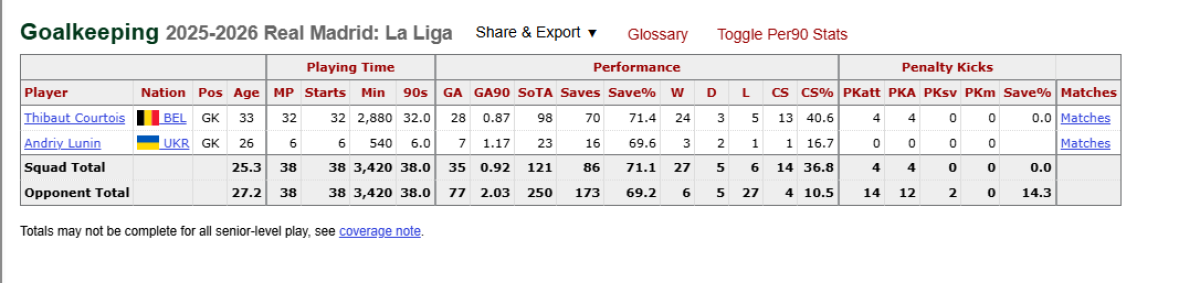
The goalkeeping table answers two questions that pricing pages rarely make easy. Real kept 14 clean sheets in 38 league games, a rate of 36.8 percent. Their opponents kept 4, which means Real scored in 34 of 38 matches, or 89.5 percent of the time. Anyone pricing both teams to score has both halves of that market in one table.
The same table holds the penalty record. Real were awarded 14 penalties across the league season and scored 12. They conceded 4, and all 4 were scored against them. Fourteen awards in 38 games is one every 2.7 matches. That changes a goal line directly. It is invisible in any goals-per-game average.
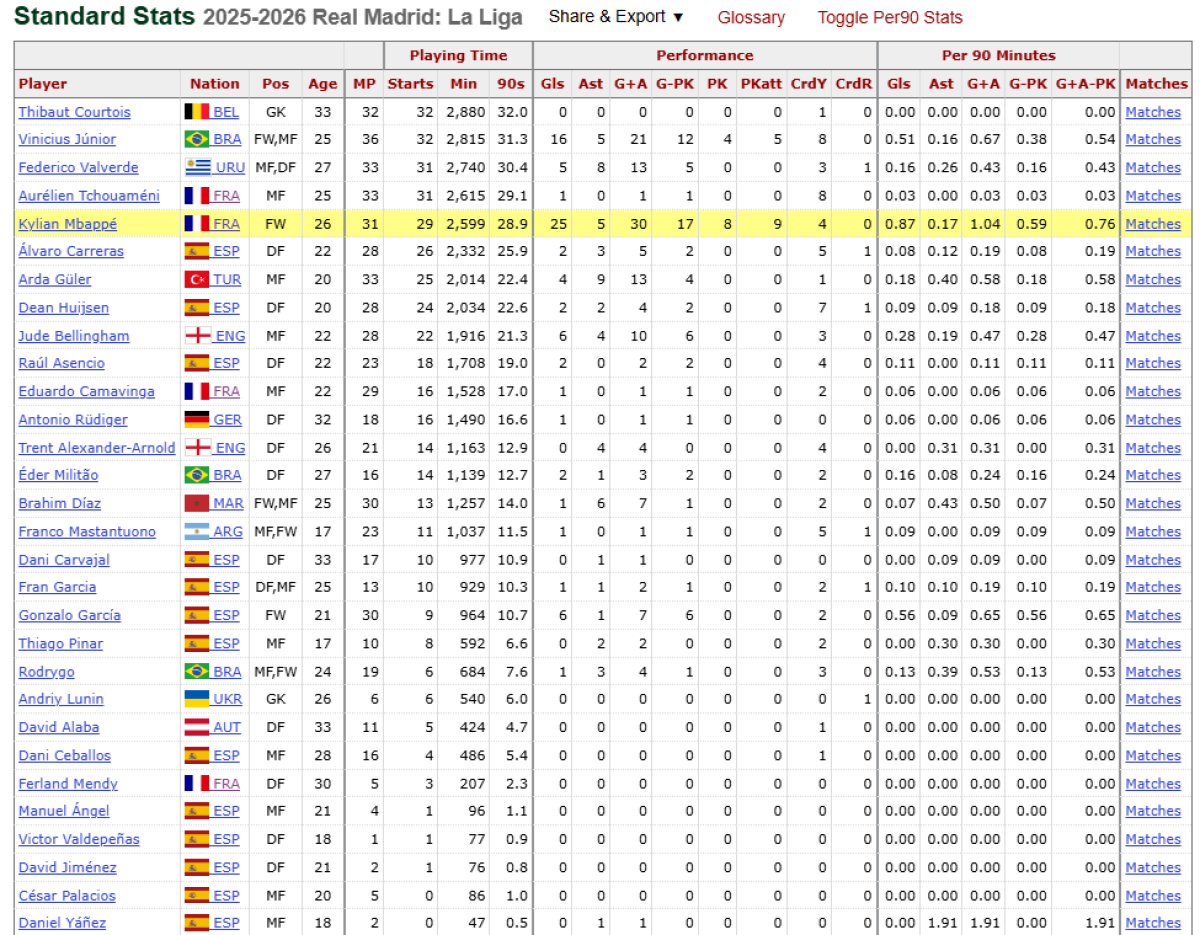
Cards work the same way. Dean Huijsen took 7 yellows in 2,034 minutes, one every 291 minutes. Aurélien Tchouaméni took 8 in 2,615, one every 327. Kylian Mbappé took 4 in 2,599, one every 650. Three players in the same team, with a threefold difference between them. The fixture log also names the referee for every match, so the two can be read together.
The penalty column changes a striker's price
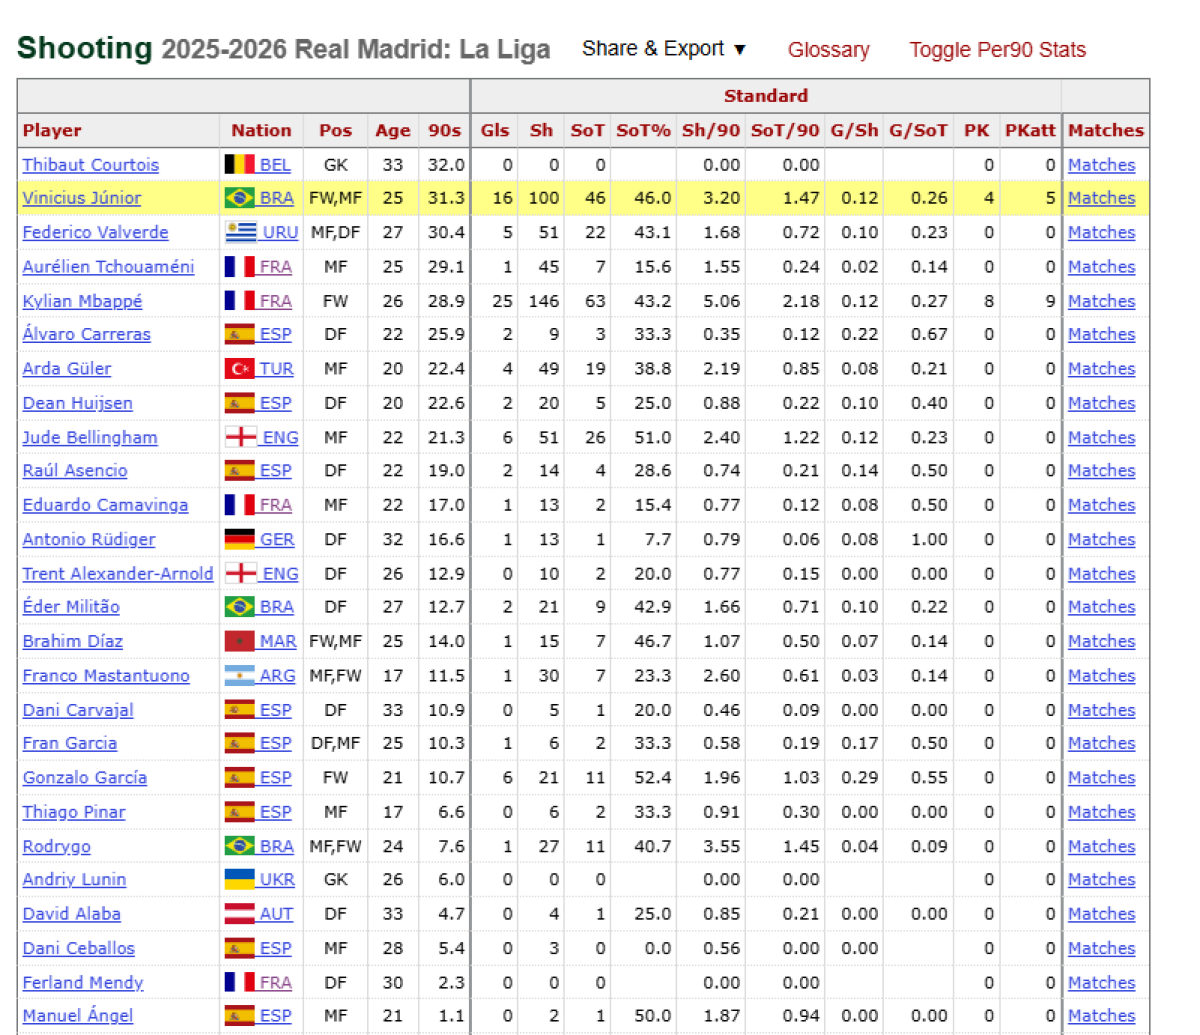
Mbappé scored 25 league goals in that season, the sort of number that sets a player market for the following August. The same row shows 8 of them were penalties, from 9 attempts.
That leaves 17 goals from open play in 2,599 minutes, one every 153 minutes. The site does the division as well, showing 0.59 non-penalty goals per 90 against 0.87 including penalties.
A third of his output depended on being the designated penalty taker. Any market that leaves penalties out is priced off the wrong number.
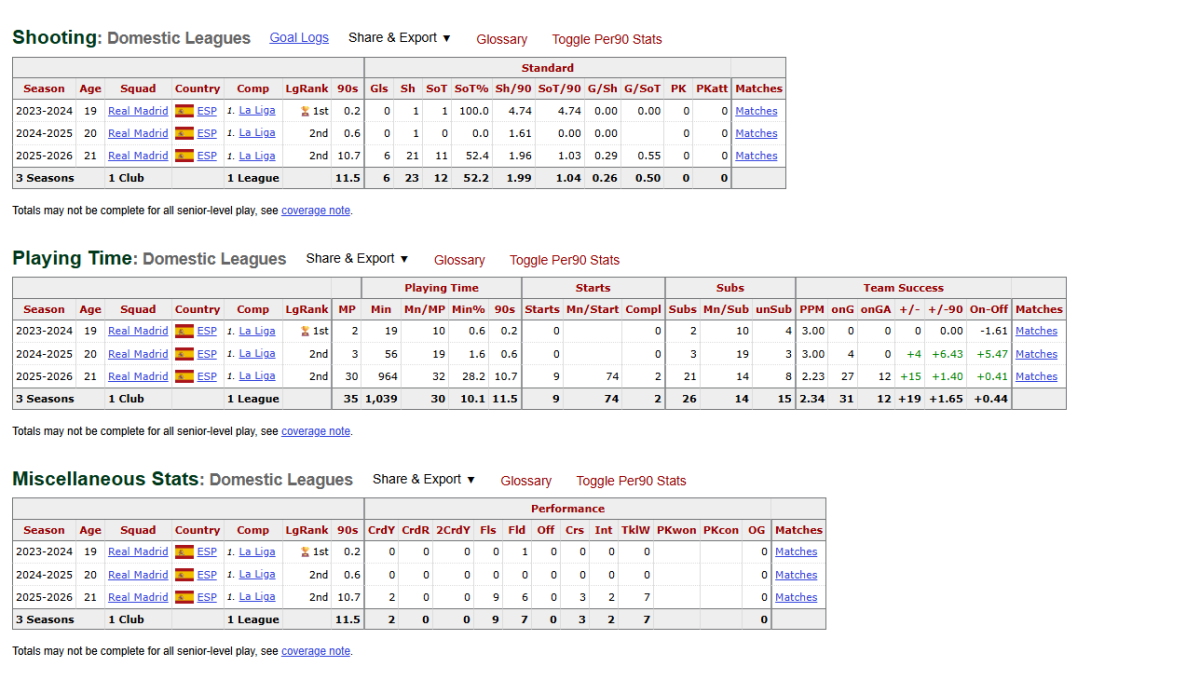
Rotation is the other half of it. Gonzalo García made 30 league appearances the same season, which reads like a regular. Nine of them were starts and 21 were from the bench. He averaged 74 minutes when he started and 14 when he came on. His 6 goals came in 964 minutes, one every 161.
So an anytime scorer price on him means two completely different things depending on the team sheet.
A start is worth about five times the playing time of a bench appearance. Half of that bet is decided by the team sheet, and the site shows you that for free.
His shooting row supports the read: 11 shots on target and 6 goals, a conversion of 0.55, tenth in the league that season on that measure.
Head to head, one click from the fixture list
FBref has carried head-to-head pages since 2020, and they came through January untouched because they are built from results rather than licensed metrics.
Two page types do the work. A Records vs Opponents page ranks every club a team has faced, with wins, draws, defeats and goal difference against each. A Historical Head-to-Head page takes one pairing and lists every meeting. The list is split by competition, so a league record and a cup record stay apart instead of being averaged together.
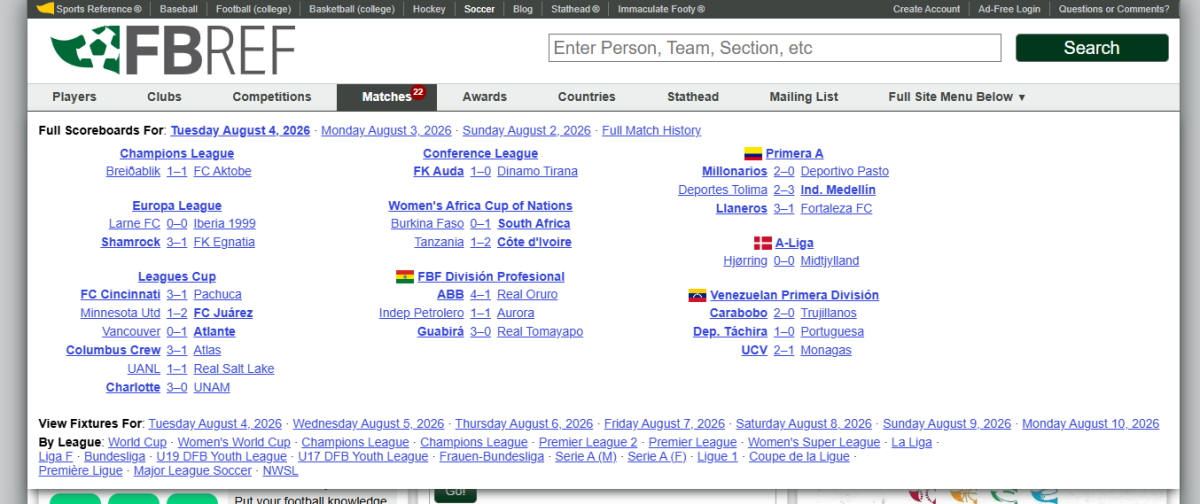
The quickest route is the daily Matches page, where each upcoming fixture carries its own head-to-head link. That is one click from the fixture to the full meeting history, which is faster than any bookmaker's own statistics tab and considerably deeper.
FBref labels these pages as possibly incomplete, because its archive covers different competitions in different years. A head-to-head total is a record of the matches FBref holds, not necessarily every match ever played between the two clubs.
The leagues nobody else bothers with
Coverage below the big five is where FBref is still ahead of everyone. Argentine, Bolivian, Venezuelan, Colombian, Austrian, Belgian and Danish football all sit in the daily scoreboard, alongside women's competitions in nine countries and youth leagues in the top European nations.
Bookmakers price these markets with less care than the Premier League, and the gap between two books on the same match is often wider here than anywhere else, which is what an odds comparison site is for. The research that answers that is exactly the research described above: splits, clean sheet rates, penalty counts, minutes, cards and meeting history. None of it needs a model. FBref has all of it as free football statistics, in leagues where Understat and most stats sites simply stop.
One practical catch. The books that price a Bolivian or Danish fixture are not always the ones you already hold an account with, so this research often means opening a new one. Our welcome offer comparison covers what those accounts are worth on the first deposit.
No xG on FBref: what that costs a bettor
Any review that still calls FBref the best free source of expected goals is describing a site that stopped existing in January.
There is no xG anywhere now, and nothing derived from it. No shot maps, no percentile radar for a player against others in his position, no progressive passing or carrying numbers, no pressure counts, no possession broken down by third of the pitch. The match log types for passing, defensive actions and possession are gone from squad pages entirely. The pages explaining how those metrics were calculated are still linked in the footer, which is confusing, but the numbers behind them are deleted.
What is lost is the ability to judge quality. Shot counts show what a team did. Expected goals showed how good the chances were. That is what separates a team finishing above its level from a team that is genuinely creating. Nothing on FBref answers that question now.
Three older limits also still apply. FBref is not a live product, so in play bettors get nothing from it. The tables are dense, so a phone screen means a lot of sideways scrolling. And most pages carry a note that totals may be incomplete, because coverage varies by competition and by year, which matters most on anything historical.
Exporting, and the packages built on FBref
Every table has a Share and Export menu, which turns it into a spreadsheet without any copying by hand. For one team over one season, that is all you need.
Above that sits a small ecosystem. worldfootballR pulls FBref into R, while soccerdata and fbrefdata do the same for Python, and a large amount of public football analysis runs through them. FBref added rate limiting before any of this happened, so those packages now wait between page requests. A large pull is slow.
What January changed for them is narrow but total. The functions that read schedules, results and basic season tables still work. The ones written to read expected goals and the possession tables have nothing left to return. Anyone whose model reads those fields is rebuilding it around another source.
Stathead, and what a subscription buys now
Stathead is the paid search layer over the Sports Reference databases. FBref sits inside it as one of five choices, next to baseball, basketball, American football and hockey.
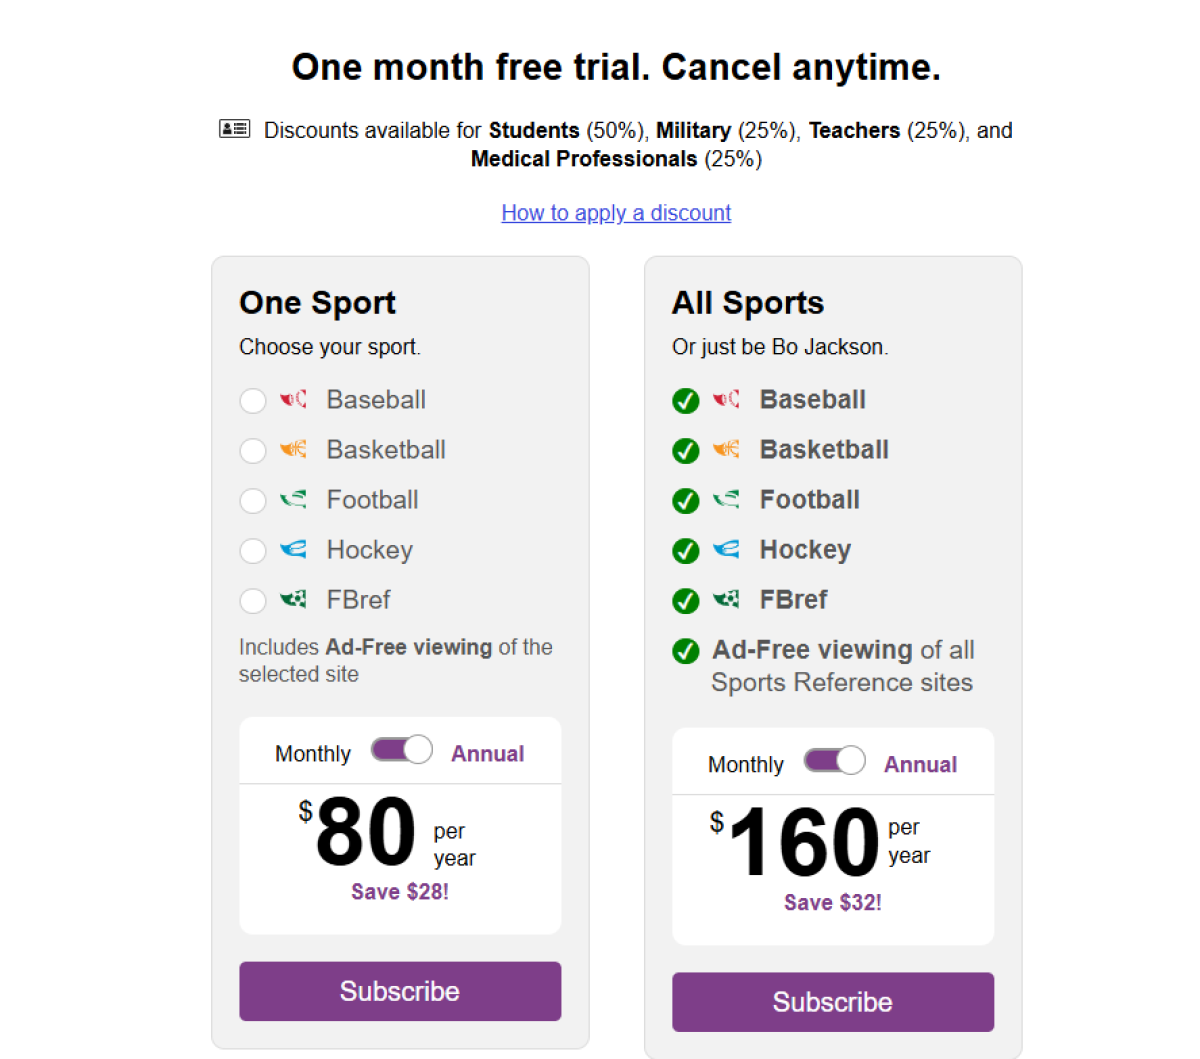
One sport costs $9 a month, or $80 for a year, which saves $28. All five cost $16 a month or $160 a year. The first month is free, the plan can be canceled at any time, and there are discounts of 50 percent for students and 25 percent for teachers, military staff and medical staff.
The money buys query power. It does not buy extra data. Three things are behind the payment. None of them is a number the free site hides:
Search tools that ask the whole database a question instead of one page at a time.
Custom leaderboards built from your own filters.
Pages with no advertising.
Everything a squad page, a player page or a head-to-head page shows stays free. The subscription is useful for questions that span seasons. Which players scored in five straight away games in the last three years, for example. That one is painful to answer by hand.
The subscription also settles the advertising question. Ad free viewing of FBref is not sold on its own. It comes bundled with Stathead, so the $9 covers the search tools and the clean pages together.
The removal cut into this product as well. The advanced filters went with the advanced data, so a Stathead subscription now searches basic stats only. Check that before the free month turns into a charge.
Free access and the sister sites
The site itself is free and needs no account. Advertising pays for it, and the only way to switch the ads off is the Stathead subscription above.
FBref belongs to the Sports Reference family, next to Baseball Reference, Pro Football Reference and Basketball Reference. The layout, the sorting, the export menus and the sharing tools work the same way across all of them. Anyone who has used the American sites will find their way around FBref in about a minute.
Where each number lives now
The removal did not delete a category. It moved specific numbers to specific places.
Expected goals and expected assists, at match and player level, are on Understat for six European leagues, free and open. SofaScore and FotMob publish their own expected goals, from their own models, and both have the live coverage FBref never had. Their numbers should not be mixed with anyone else's in one comparison. The Analyst is Opta's own consumer site, so the data there is the source data, presented through articles rather than tables. Our full comparison of the FBref alternatives sits in the category hub, including what each one costs and which leagues it actually covers.
Everything else stayed where it was. Results, splits, match logs, minutes, starts, substitutions, cards, fouls, penalties, saves, clean sheets and head-to-head history are all still on FBref. No alternative covers as many competitions in that depth.
Anyone who pulled FBref tables into a spreadsheet for modeling has a problem. No free replacement of the same breadth exists yet.
Is FBref still worth opening
Yes, for a narrower job than before, and a more useful one than most people assume. The worked example above used nothing that was deleted. Home and away splits, clean sheet rates, penalties, cards per minute, starts against substitute appearances, meeting history. All of it survived. All of it maps onto markets that get priced every week.
As the analytics tool it was in 2025, no. That version is gone. Anyone starting now should treat FBref as the record of what happened and get the modeling numbers elsewhere. What the site will never tell you is how much to stake once the research is done.
Frequently asked questions
What happened to FBref?
Is FBref still free in 2026?
Does FBref still show shots and cards?
Does FBref have head to head records?
Can FBref be used for betting research?