
A football strategy builder tested on its own database
Betaminic is a Spanish company that keeps fourteen years of football results and betting odds in one database. Its main tool, Betamin Builder, lets you filter that history and see what a betting rule would have earned.
This Betaminic review is hands-on. We used the free plan and built one strategy on purpose to look good. Then we checked whether it survived a simple test.

Pros
- 14 years of odds across 111 leagues
- Free plan runs the builder and graphs
- Since shared filter shows real results
- Manual renewal, no surprise billing
Cons
- Strategies cannot be saved for free
- Save button asks, then blocks
- Picks priced from 10 to 30 cents each
- Automation needs a Betfair account
The database behind Betamin Builder
Betaminic Bigdata Solutions runs the site from Spain. The company also sells Betlamp, a statistics tool, and ShootingBets, an alerts bot on Telegram.
Betamin Builder covers 111 leagues and goes back to February 2012. Markets include the match result, over and under 2.5 goals, double chance and draw no bet. On the free plan only the home win market is open.
You create a strategy, then add filters on the left: odds, time period, leagues, teams and streaks. The panel above shows total bets, average odds, profit, yield and the biggest drawdown. A strategy aggregator combines several rules, and paid plans add an Excel download.
Yield is profit divided by all the money staked. A yield of 5 percent means five units of profit for every hundred units bet.

Backing every home team loses four percent
The first run used no real filter. Match result, home win, odds from 1.01 to 10, the whole database.
That gave 367,048 bets at average odds of 2.59. Home teams won 44 percent of the time. Profit came out at minus 14,782 units, a yield of minus 4.03 percent.
Every figure below is measured against that minus 4.03 percent. Betting blind loses about four percent of turnover, which is roughly the margin inside the closing prices.
Twenty minutes to a strategy that looked good
Below the graph sits a league table with all 111 leagues, sorted by any column. We sorted by yield.
Only two leagues out of 111 made money over fourteen years. Brazil Serie B returned plus 0.79 percent and Ireland Premier Division plus 0.77 percent. Both edges are small enough to be luck.
We ticked the four best leagues anyway. Yield moved from minus 4.03 percent to plus 0.19 percent, on 17,763 bets.
Then came a streak filter. The first try asked for away teams on a run of five to ten games with over 2.5 goals. That left 308 bets and a yield of minus 11.15 percent.
The mirror version of the same rule, under 2.5 goals, gave 740 bets and a yield of plus 0.68 percent. One word changed, and the result moved twelve points.
Nothing here required football knowledge. Sort a column, tick the winners, keep the filter that helps.
The same strategy on later years
Betamin Builder has a date filter, so the strategy could be split in half. The filters stayed exactly the same. Only the years changed.
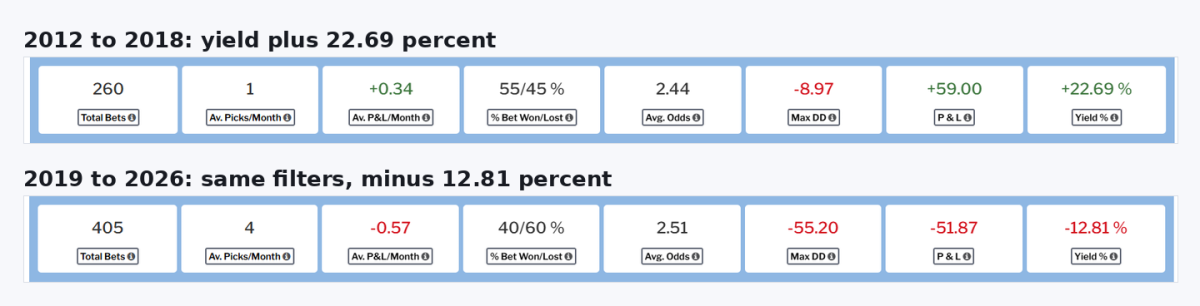
On 2012 to 2018 it produced 260 bets and a strike rate of 55 percent. Yield came out at plus 22.69 percent. The graph climbs in a straight line, and the worst drawdown is under nine units.
On 2019 to 2026 the same rules produced 405 bets and a strike rate of 40 percent. Yield came out at minus 12.81 percent. The graph falls from the first month and never recovers.
The same filters returned plus 22.69 percent on 2012 to 2018 and minus 12.81 percent on 2019 to 2026.
Testing a rule on years it has not seen is called out of sample testing. Our strategy failed it. The rule was never real. The first half only looked good because we picked the leagues from it.
Building a rule that fits the past and nothing else has a name: overfitting. A sample of 260 bets is small enough for it to happen by accident.
Repeating this test on your own account
Every setting is listed here, so the test can be run again on a free account in about fifteen minutes.
- Market type: Match Odds (1X2). Bet type: Home Win.
- Odds filter: 1.01 to 10, which excludes nothing and forces the first calculation.
- League table: sort by the Yield column, then tick the top four leagues.
- Streaks: away team, consecutive under 2.5 goals, range 5 to 10.
- Time period: run 01/01/2012 to 01/01/2018, then 01/01/2019 to 01/01/2026.
Your numbers will differ a little, because the database grows every day. The pattern is what matters. Leagues chosen from past results carry no promise about the years that follow.
Checking a public strategy before you follow it
Following a public strategy works like following a tipster, so the same care applies. The same screens answer four questions about anyone else's strategy.
- Switch the page to Since shared. Under a few hundred bets since publication proves nothing yet.
- Compare the rating with the bet count. A rating of 100 can rest on a backtest, not on live results.
- Compare max drawdown with profit. Ours showed 65 against 5, and that ratio decides whether you could hold on.
- Remember which price the yield assumes. It is the closing line, and your bet goes on earlier.
Profit of 5, drawdown of 65
Across all fourteen years the strategy made 740 bets and 5.06 units of profit. Yield came out at plus 0.68 percent.
That is the headline number a strategy page would show. Beside it sits the maximum drawdown: minus 65.20 units.
The bankroll fell 65 units at its worst point and ended 5 units ahead. Few people would keep betting through a loss that size. The single yield figure also hides both halves of the history.
A profit of 5 units sat behind a drawdown of 65.
Closing odds in the results, opening odds in your inbox
Each strategy has a table of its bets, and that table has two odds columns: opening and closing. Opening odds are the bookmaker's first price. Closing odds are Pinnacle's last price before kick-off.
We checked the profit column against both. A winner at 3.09 opening and 3.17 closing paid 2.17. One at 1.67 opening and 1.46 closing paid 0.46. Every row matched the closing price.
So every yield on the site is measured at the closing line. The company says picks are emailed 36 to 48 hours before kick-off, which is not when the closing line exists.
Beating the closing line is the hardest test in betting, so results measured that way are impressive. A bet that beats it is a real value bet. They are still not the prices a follower gets.
Strategies from 2020 that still work
The Public Strategies page holds around 1,230 shared strategies. A filter called Since shared drops the backtest and counts only the bets since the strategy was published.
That filter is the fairest measure on the site. It answers the same question we put to our own strategy.
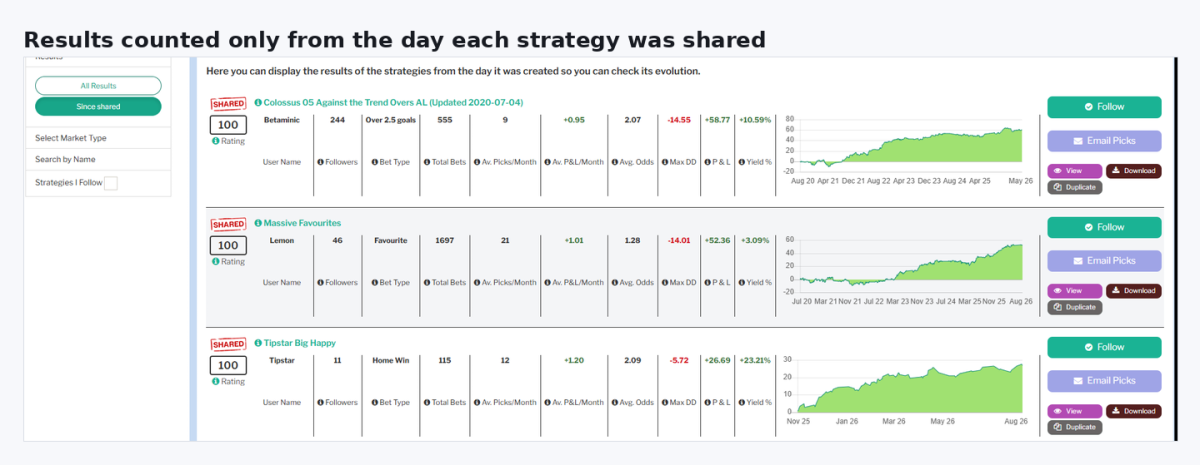
Colossus 05 dates from 2020 and comes from Betaminic itself. Its full record is 1,591 bets at plus 10.48 percent. Since sharing, it has run 555 more bets at plus 10.59 percent.
Pro6, also from 2020, shows plus 10.24 percent overall and plus 9.48 percent across 710 bets since sharing. Massive Favourites slipped from plus 4.87 to plus 3.09 percent over 1,697 later bets, and stayed profitable.
Two strategies fixed in 2020 kept their edge for six more years.
Our strategy died in the second half of its own history. Theirs did not. The builder produced both, so the difference lies in how it was used.
Not one losing strategy on the whole platform
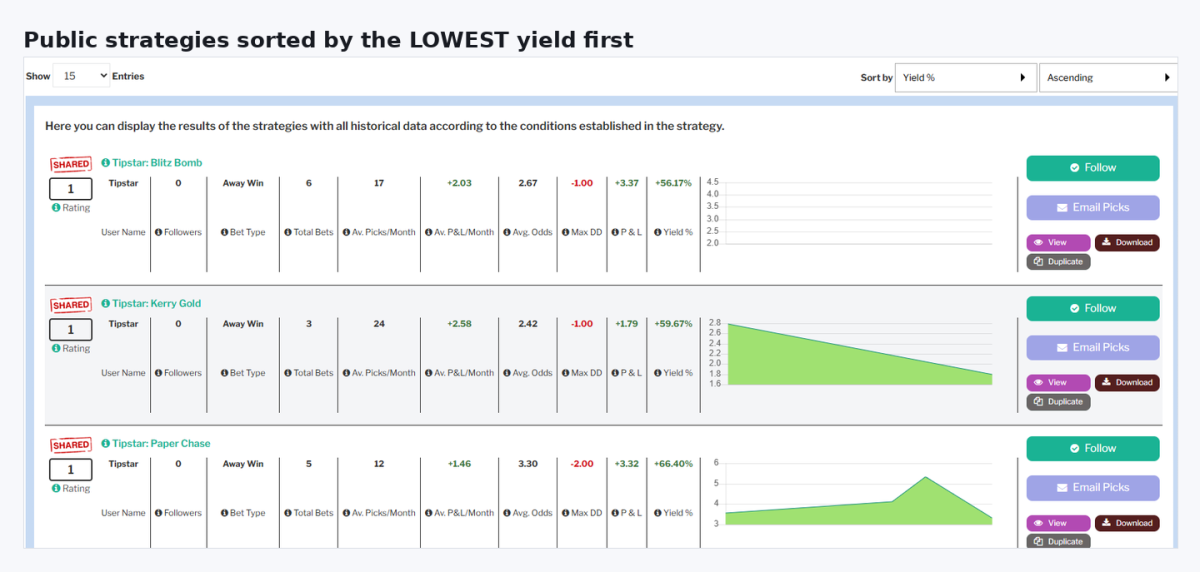
The public list can be sorted by yield with the lowest first. The bottom of it is still profitable.
The worst strategies on the platform read plus 56.17 percent, plus 59.67 percent, plus 66.40 percent and plus 69.78 percent. Each one covers three to nine bets. The result is the same in both views.
The worst of about 1,230 published strategies still shows plus 56 percent.
Out of roughly 1,230 published strategies, not one shows a loss. Thousands of people building rules would produce plenty of losers. The failures are deleted, unshared, or never published at all.
Our own strategy shows how thin the line is. Its headline yield is plus 0.68 percent, so it would join the list as a winner. Its last seven years are heavily negative.
That pattern has a name: survivorship bias. You see the survivors, and the failures leave no trace.
This does not make the winners fake. It means the list only holds the strategies that worked. The six-year records above have to be read with that in mind.
Betaminic's rating column does handle the small samples well. Those 56 percent strategies carry a rating of 1, while the long-running ones carry 100. Sort by yield instead of rating and the protection disappears.
The limits of the free plan
The free plan is real, and the whole test above ran on it. Strategy building, the league table, the graphs and the filters all work without paying.
Four limits appear later. Picks are not included at all. Only the home win market is open. Private strategies show their last ten bets. Strategies cannot be saved.
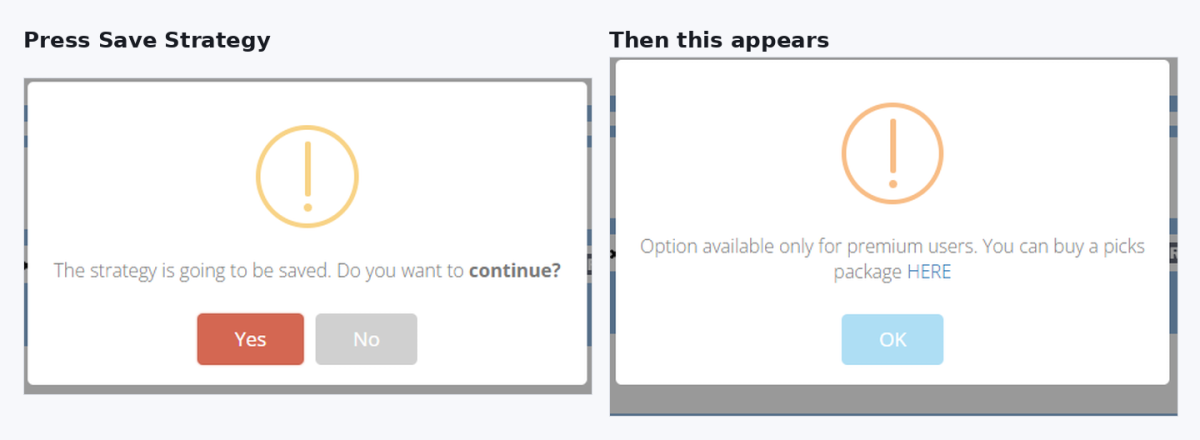
The Save Strategy button sits in the sidebar and asks you to confirm. Only after you press Yes does the message appear, and it says saving is for premium users.
An hour of filter work can end at that dialog. Screenshot as you go, or write the filters down.
The price of a pick
Two packages exist. Starter costs 29.90 euro and includes 100 picks over seven days. Pro costs 99.90 euro and includes 1,000 picks over thirty days. Renewal is manual, so nothing bills you by surprise.
Divide one by the other. Starter charges 30 cents a pick and Pro charges 10 cents. The small package costs three times more per pick.
Now find the stake that covers it. Profit on a pick is your stake times your yield. At a 5 percent yield, Pro needs stakes of 2 euro before the fee is paid back. Starter needs 6 euro. At 3 percent, those become 3.33 euro and 10 euro.
Below those stakes the fee costs more than the strategy earns. The other two products are priced separately again. Betlamp runs 14.99 euro a month or 99.99 euro a year. ShootingBets is 49.99 euro for thirty days.
Automation needs an exchange
Picks can be pushed into BF Bot Manager, which places bets on the Betfair exchange. That means a second subscription and an exchange account.
Exchanges are licensed in a short list of countries, so this route is closed for many readers. The rest of Betaminic needs no betting account at all, which is why the tool itself works anywhere.
The bettor Betaminic suits
The database is the product, and it is a good one. Fourteen years of odds across 111 leagues, free to search, is more than most paid services give.
Use it to test ideas you already have. Check whether a rule you believe in survives the years you did not look at. Read the Since shared column before following anyone. Our Staking Machine review covers the same trap from the staking side. Our bet tracker guide covers the logging side.
Do not use it to choose strategies to follow. The list only shows the ones that survived. The yields are measured at prices you cannot bet on. The builder will draw a beautiful graph for a rule that means nothing. Ours was exactly that.
Frequently asked questions
Does Betaminic need a bookmaker account?
Is the Betaminic free plan limited in time?
Which sports does Betaminic cover?
Do the picks arrive in time to place a bet?